Selected examples from operating wind farms, published with permission. Methods and operating context matter as much as the headline result.
Wind vane calibration · Energiekontor AG
Wind vane corrections tested with Energiekontor AG.
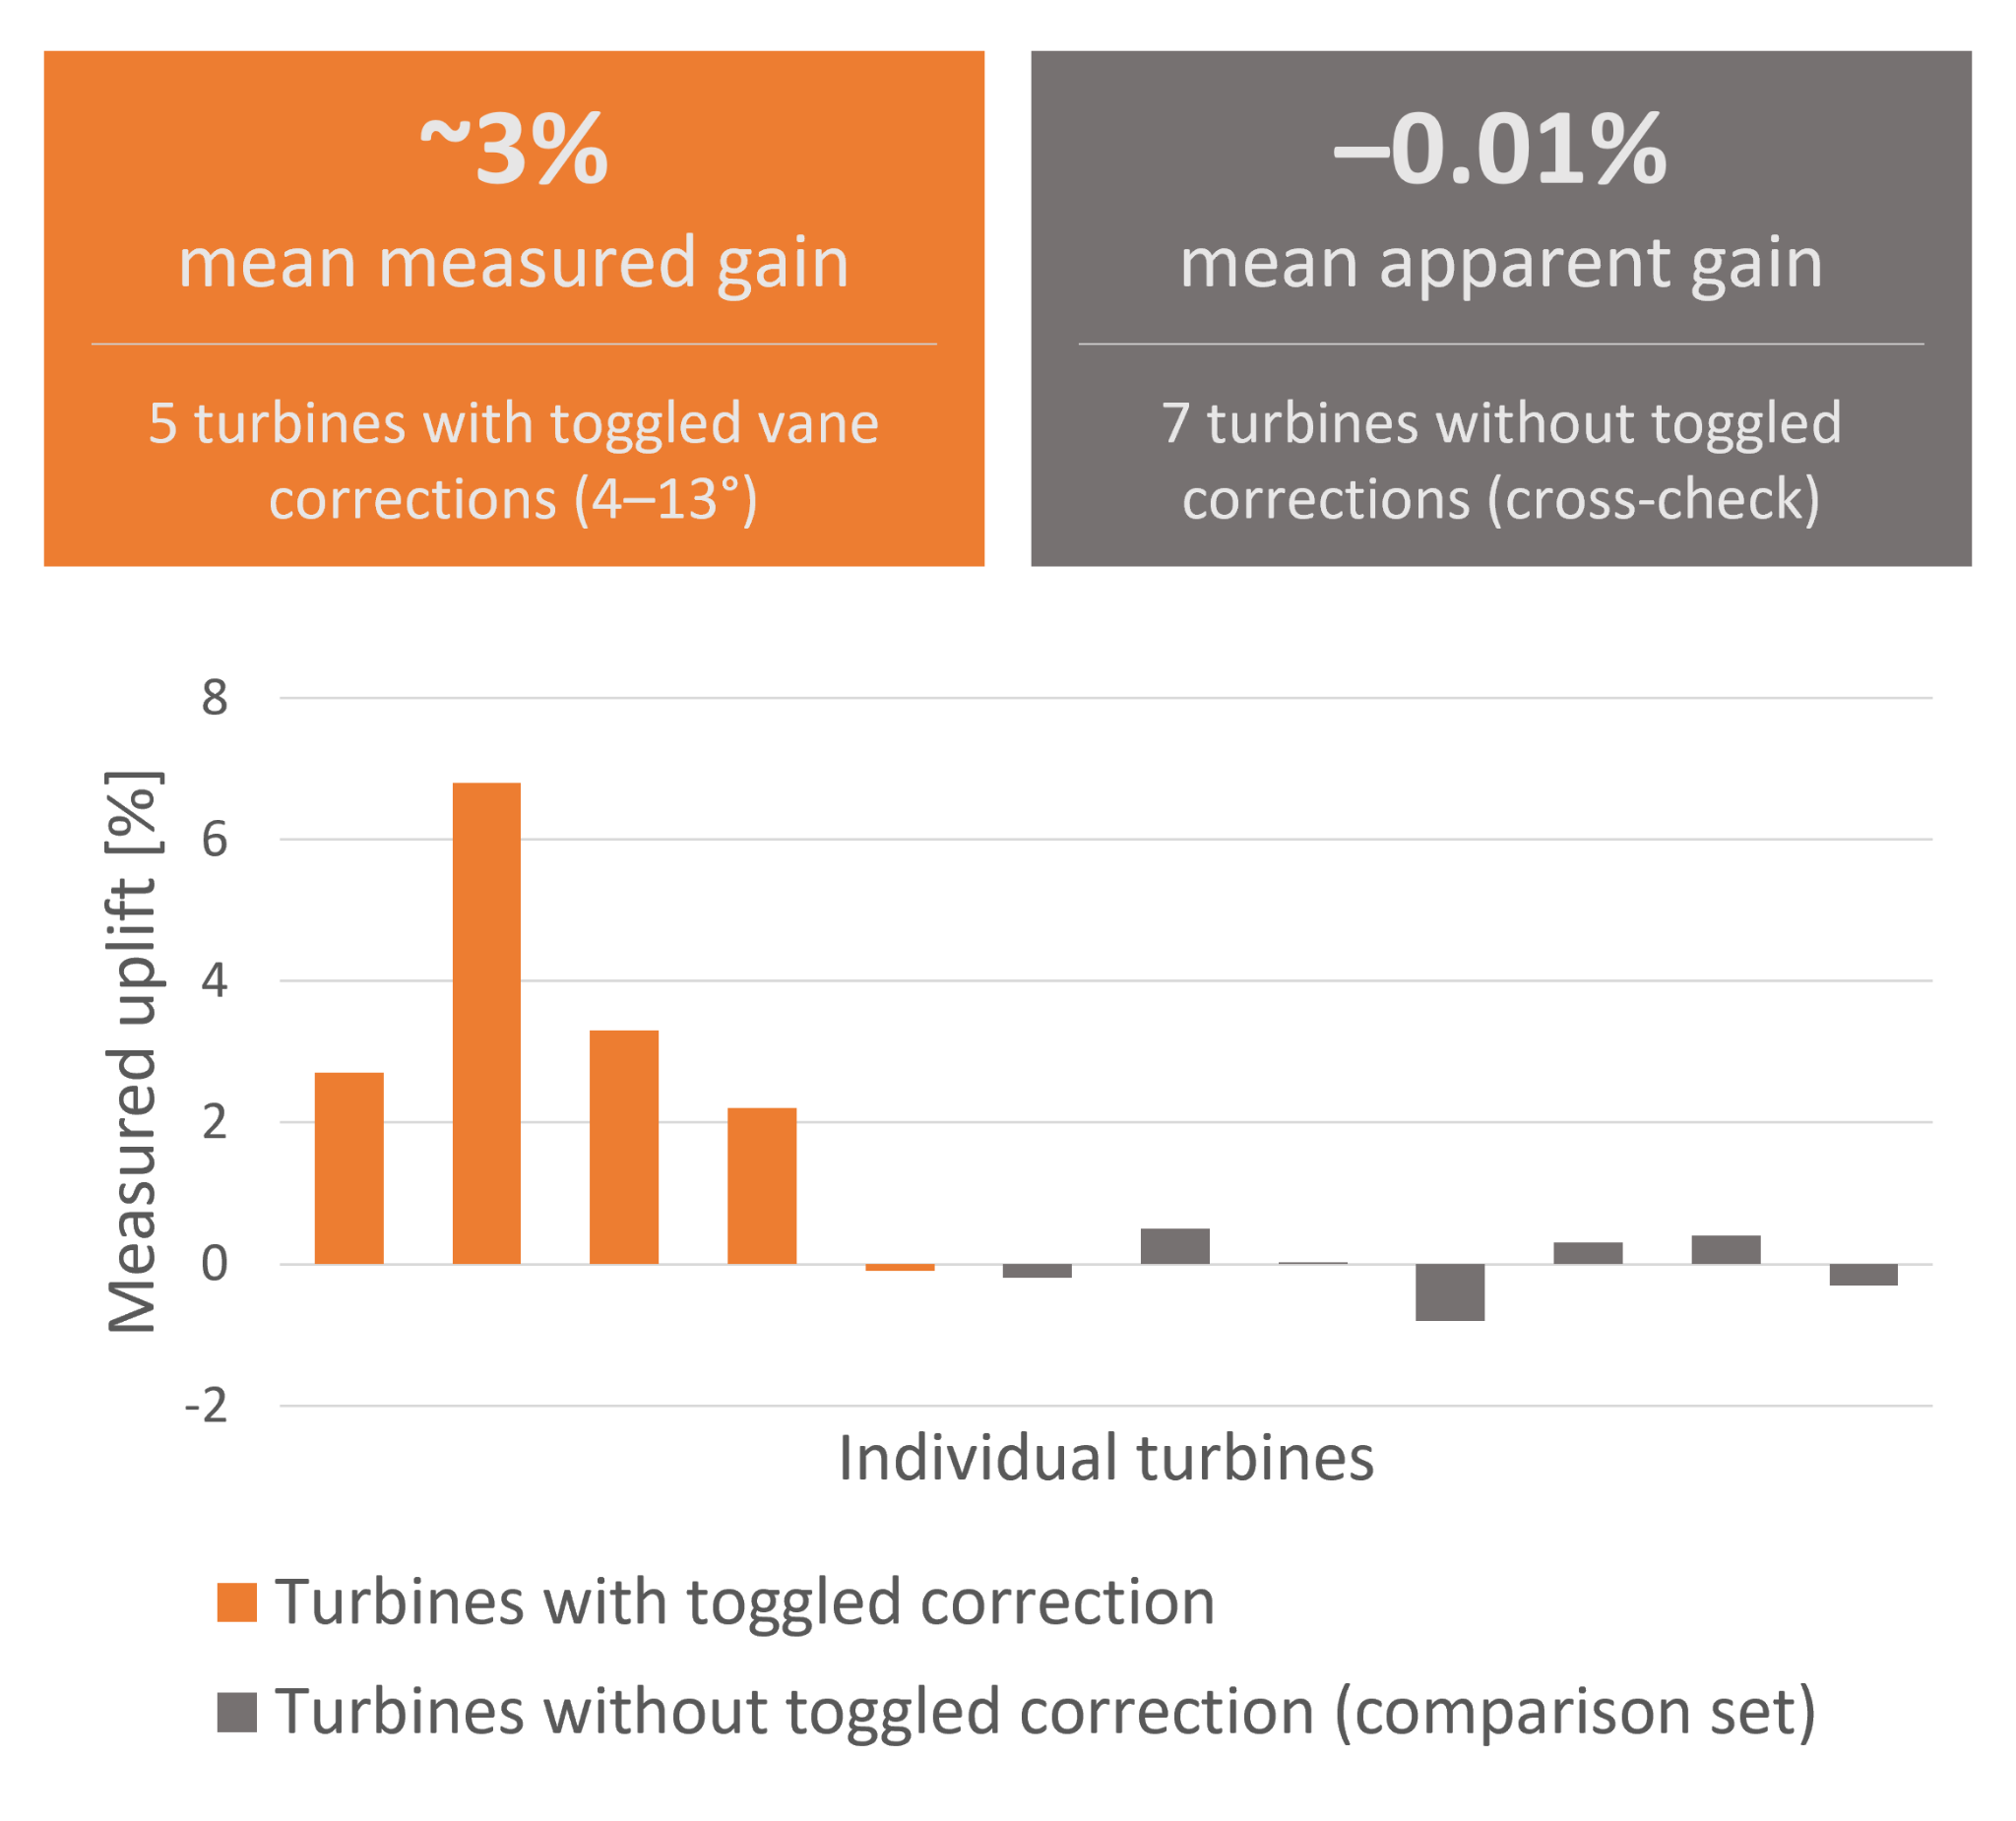
Together with Energiekontor AG, we repeatedly switched wind vane corrections on and off on five turbines and evaluated production changes against reference turbines.
About 3% mean measured gain
across the five turbines during this campaign.
The same evaluation applied to seven turbines without toggled corrections gave a mean apparent gain of −0.01%, consistent with the expected 0% and providing an additional cross-check.
The gain is specific to this campaign; it is not an annual energy yield forecast or a prediction for another wind farm.
windalytics Alignment identifies likely calibration issues in historical SCADA data. Measuring uplift after correction can be scoped as a separate follow-up.
Correction-on/off campaign and comparison set. Open the full-size figure to inspect the individual turbine results. View full-size figure
Wake modeling · offshore wind farm
Validate the model against the operating wind farm.
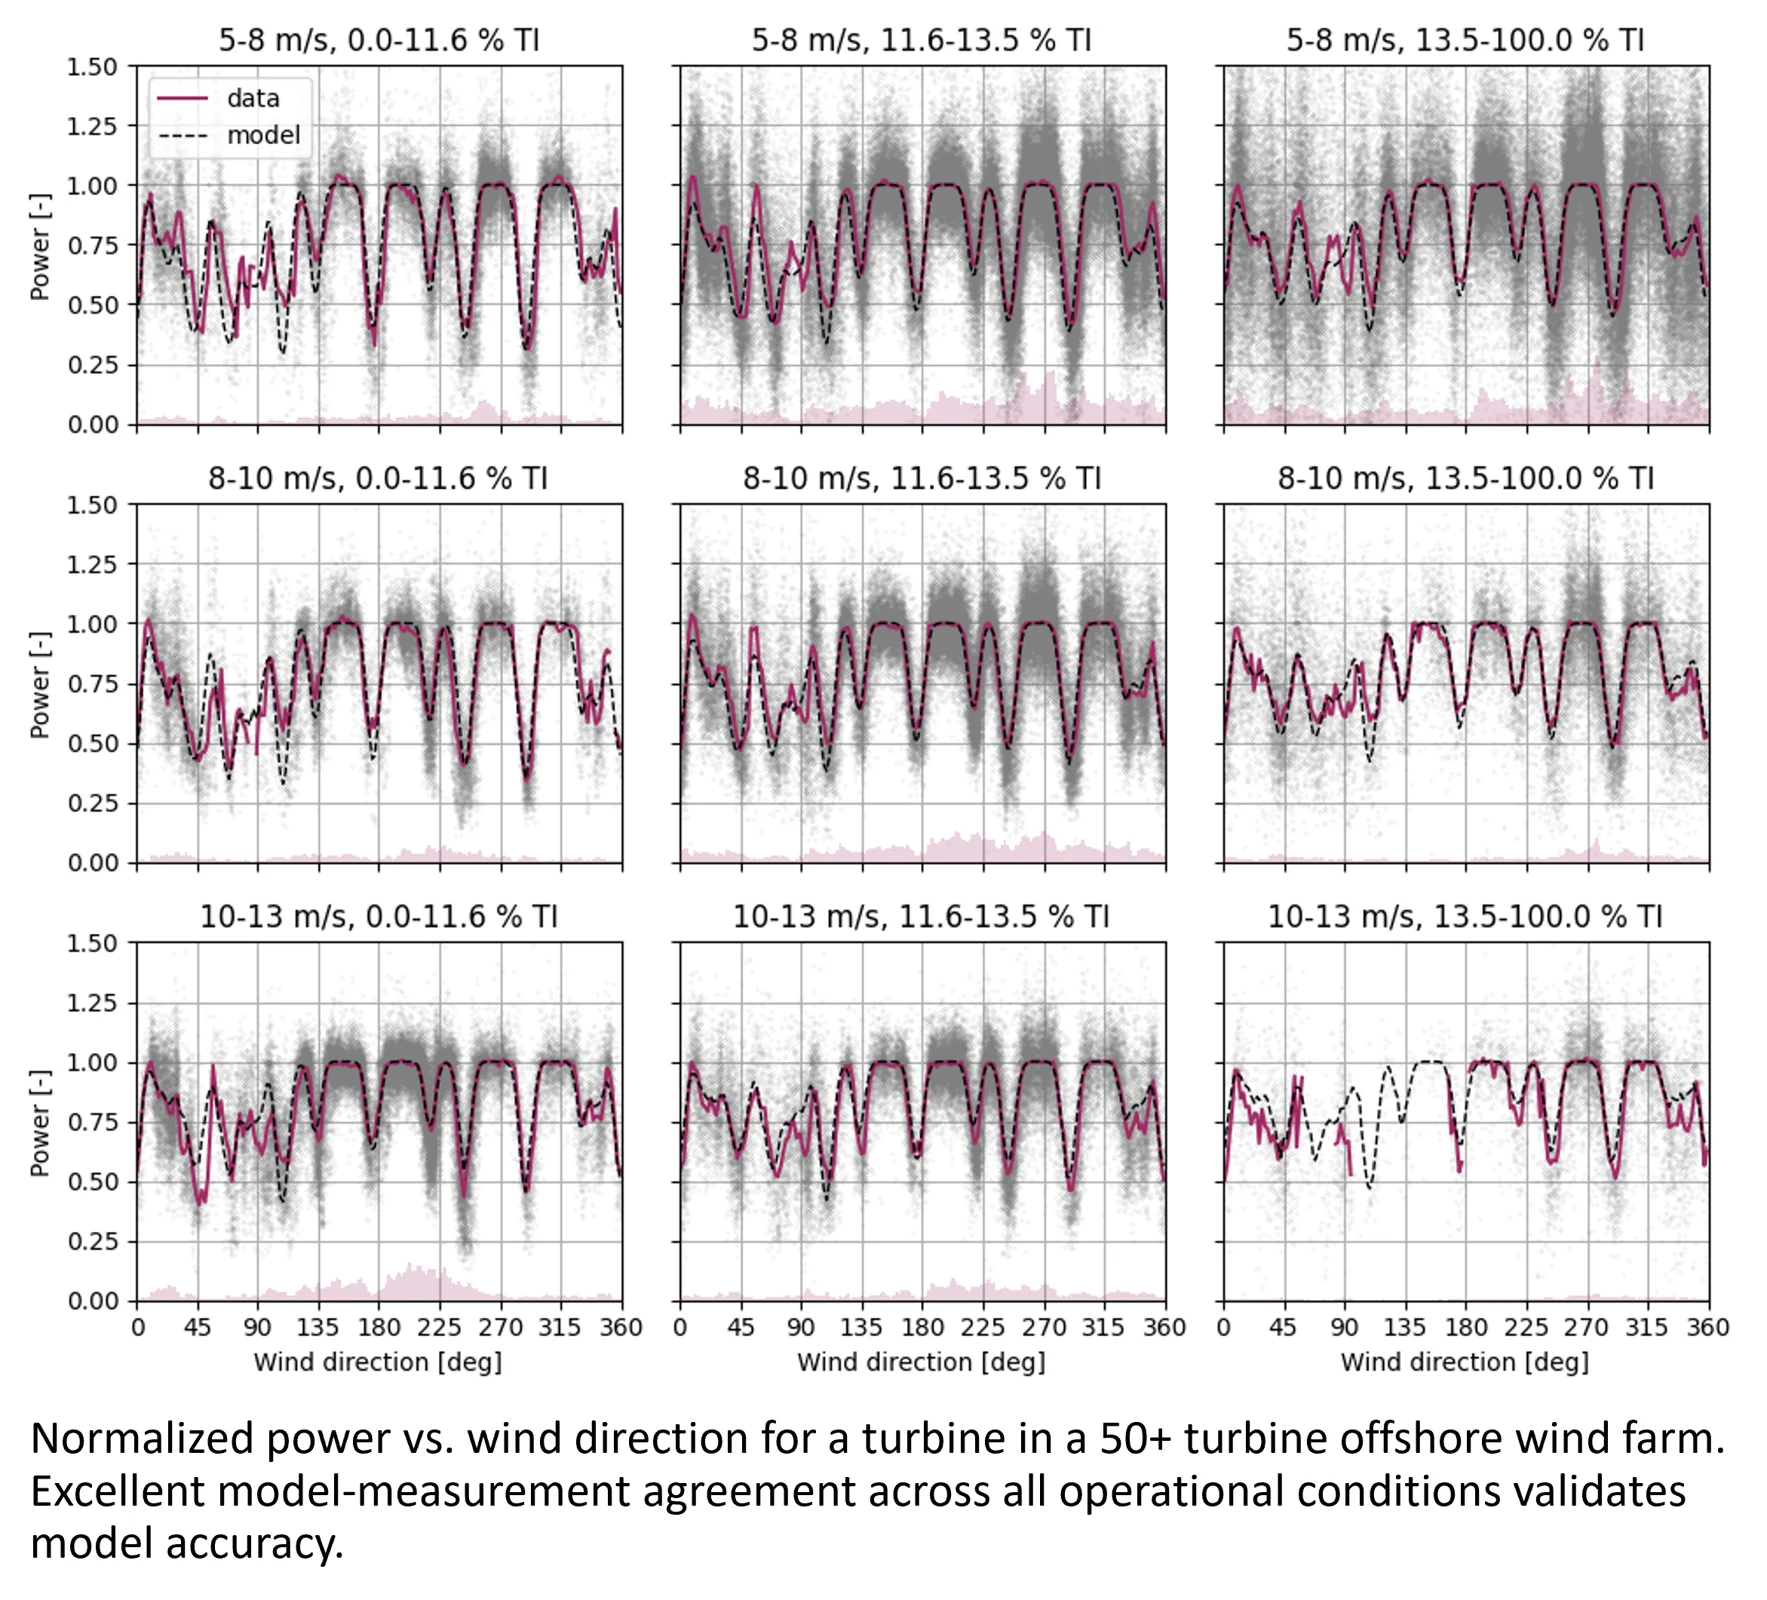
SCADA measurements and wake-model predictions showed close agreement across wind direction, wind speed, and turbulence bins in a wind farm with more than 50 turbines.
50+ turbines
in the wind farm used for wake-model validation.
Upstream wakes caused production losses greater than 50% in some operating conditions.
A persistent mismatch near 90° was traced to the wake of an offshore converter platform that had not been included in the model.
A validated model supports wake-loss attribution, benchmarking, wind condition assessment, and control studies.
Normalized turbine power versus wind direction: SCADA observations and model predictions. View full-size figure
Wake steering · Withernwick, UK
From an AEP estimate to commercial field operation.
Wake steering was implemented at Withernwick, an onshore wind farm with 13 closely spaced turbines, in collaboration with Energiekontor AG.
Controlled on/off verification
on two turbines equipped with a wake-steering park controller.
Repeated controller-on and controller-off operation enabled comparison under real wind farm conditions.
Measured production gains aligned with the pre-deployment annual energy production estimate.
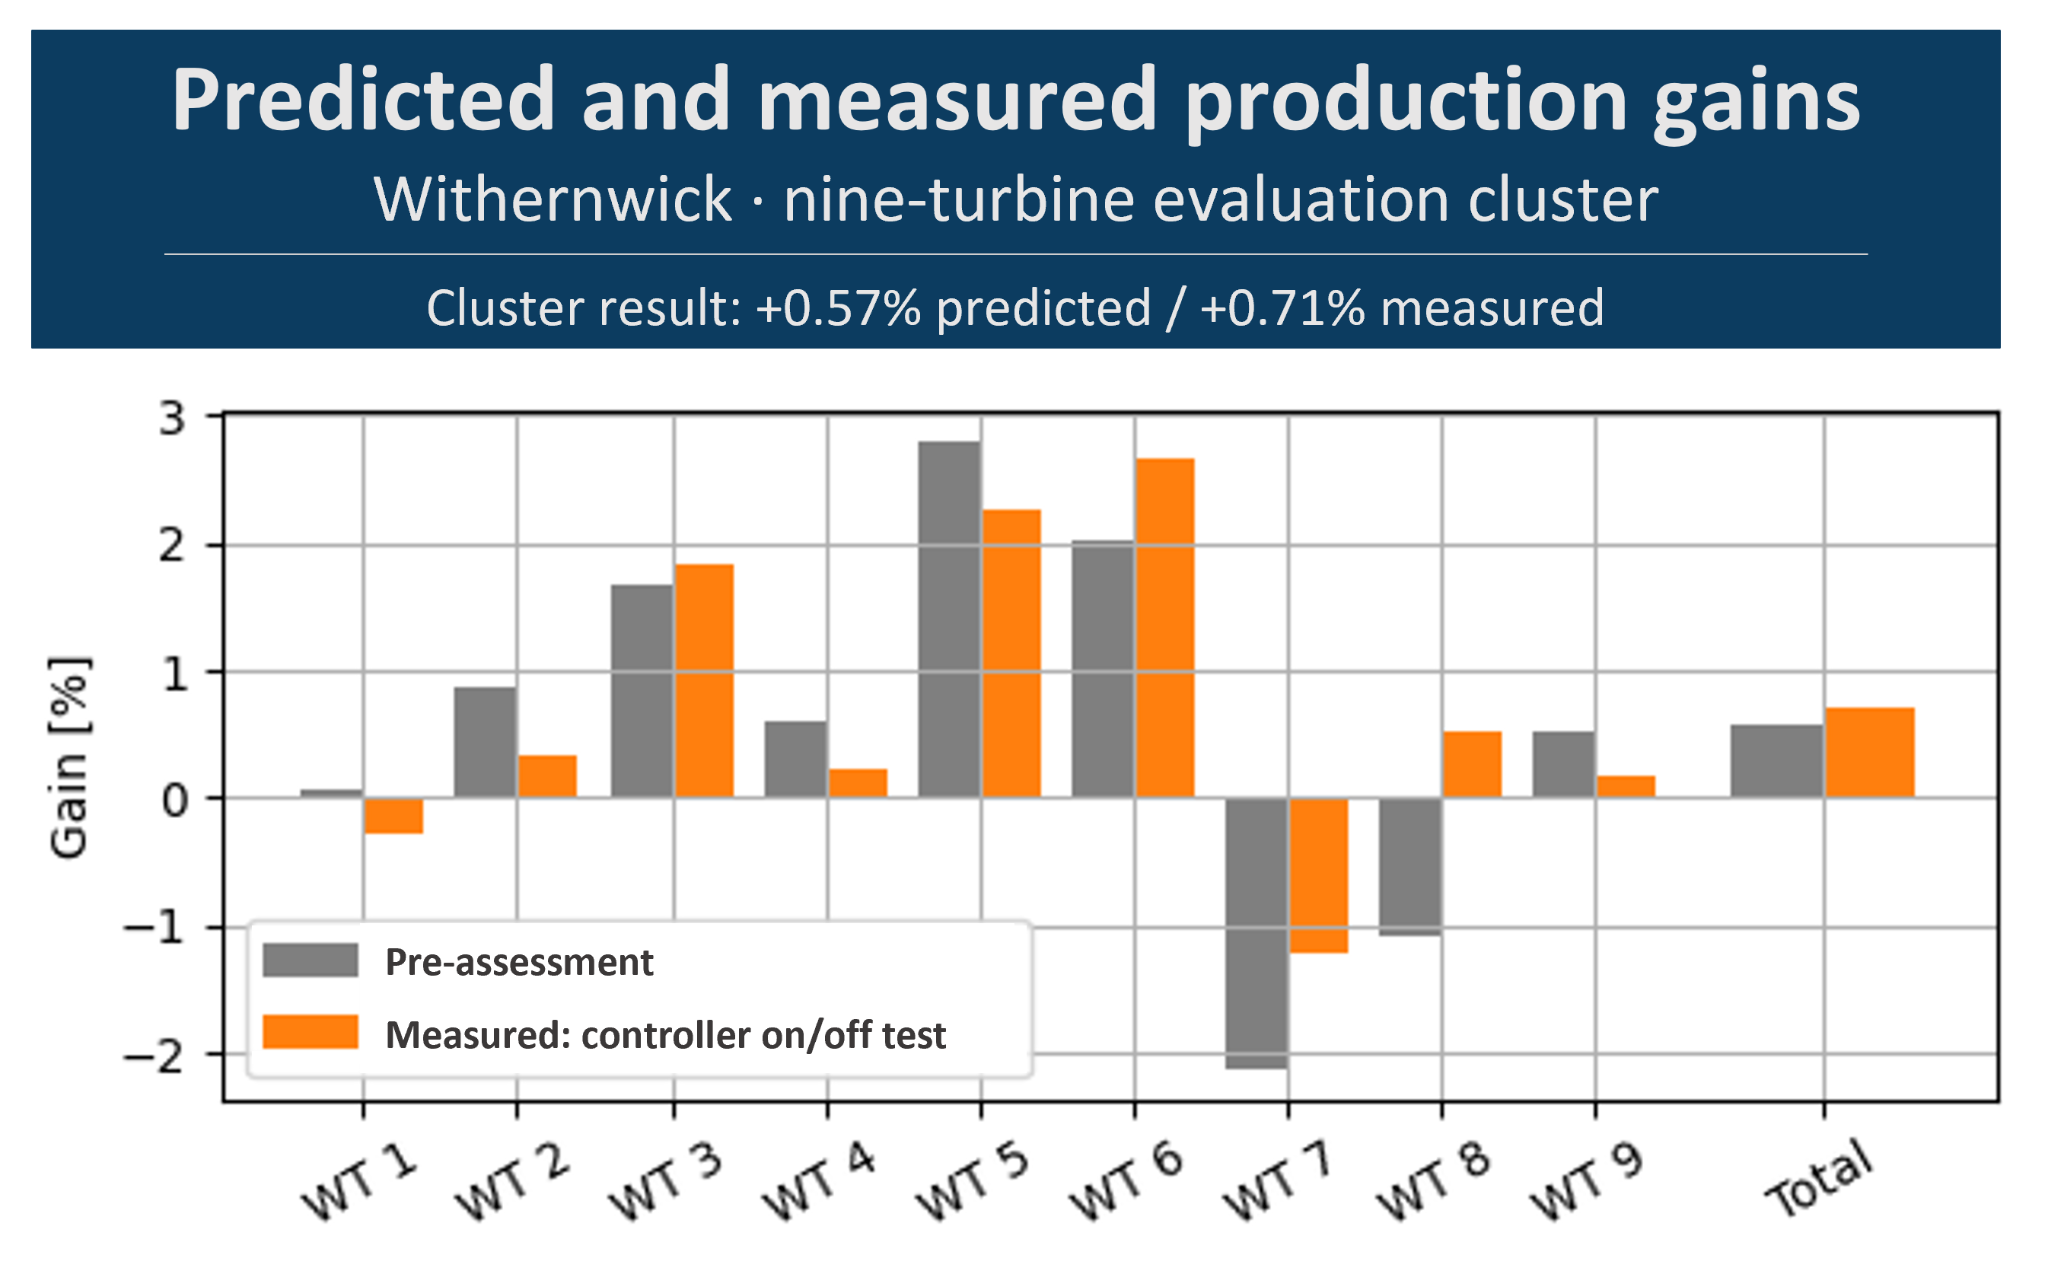
The nine-turbine evaluation cluster showed +0.71% measured gain, compared with +0.57% predicted. This campaign result is not a guaranteed gain at other sites.
Wake steering was applied to WT7 and WT8; production effects were evaluated across the nine-turbine cluster. Predicted cluster gain: +0.57%; measured: +0.71%. These results are specific to this campaign. View full-size figure
These are site-specific results. They do not establish a guaranteed uplift for every wind farm. Data availability, turbine behavior, wind conditions, and validation design determine what can be concluded.
A practical next step
Let’s look at your wind farm.
Start with a short conversation about your question and the most useful next step.